The Great Migration in Cleveland: How Black Southerners Remade the City
The Great Migration brought Black Southerners to Cleveland from the 1910s to the 1970s, and its Black population grew from 8,448 in 1910 to 287,841 in 1970.
The Great Migration was the movement of roughly six million Black Southerners to cities in the North, Midwest and West between the 1910s and the 1970s, and it remade Cleveland. The city’s Black population grew from 8,448 in 1910 to 287,841 in 1970, building churches, institutions and neighborhoods from Central Avenue to Hough, Glenville and East Cleveland, even as discrimination and redlining limited where families could live.
This is the story behind much of Cleveland’s modern East Side and much of Cuyahoga County’s Black history. It is told here through census figures, the Encyclopedia of Cleveland History, federal mapping records and the voices of East Clevelanders recorded in 2025.
At a glance
- About six million Black people left the South for Northern, Midwestern and Western states, roughly from the 1910s until the 1970s, according to the National Archives.
- Cleveland counted 8,448 Black residents in 1910 (1.5 percent of the city) and 287,841 in 1970 (38.3 percent).
- The first large community formed in the Central Avenue district, between the Cuyahoga River and East 40th Street.
- After World War II, Black Clevelanders moved east into Hough and Glenville, and in the 1960s into East Cleveland.
- The federal Home Owners’ Loan Corporation mapped Cleveland’s neighborhoods for mortgage risk in 1939.
What was the Great Migration?
The National Archives describes the Great Migration as the movement of approximately six million Black people from the American South to Northern, Midwestern and Western states, roughly from the 1910s until the 1970s. In its account, people left to escape racial violence, to pursue economic and educational opportunities, and to obtain freedom from the oppression of Jim Crow.
In Cleveland, the movement came in waves. Historian Kenneth Kusmer, writing in the Encyclopedia of Cleveland History, dates the beginnings of mass migration from the South to 1890 through 1915, when about 10,000 Black residents lived in the city by World War I. Industrial demand and a sharp decline in immigration from abroad during World War I opened jobs, and hundreds of thousands of Black migrants came north after 1916.
Migration from the South slowed to a trickle during the Depression of the 1930s. World War II revived industry and created a new demand for Black labor, which, together with the more egalitarian practices of the new Congress of Industrial Organizations (CIO), set off a second great wave.
How much did Cleveland’s Black population grow?
The census tells the story in numbers. These figures come from a Census Bureau compilation of historical counts by race for large cities.
| Census year | Black residents of Cleveland | Share of city population |
|---|---|---|
| 1910 | 8,448 | 1.5% |
| 1920 | 34,451 | 4.3% |
| 1930 | 71,899 | 8.0% |
| 1940 | 84,504 | 9.6% |
| 1950 | 147,847 | 16.2% |
| 1960 | 250,818 | 28.6% |
| 1970 | 287,841 | 38.3% |
| 1980 | 251,347 | 43.8% |
| 1990 | 235,405 | 46.6% |
Two patterns stand out. The Black population quadrupled between 1910 and 1920, and it grew by about 166,000 people between 1940 and 1960. After 1970 the number of Black residents fell, but their share of the city kept rising, because Cleveland’s total population dropped from 750,903 in 1970 to 505,616 in 1990.
Where did Black newcomers settle in Cleveland?
Most early migrants settled in the Central Avenue district, between the Cuyahoga River and East 40th Street. The lower Central area also housed many poor Italian and Jewish immigrants at the time, but the Black community became steadily more concentrated there. Kusmer writes that between 1915 and 1930 the district expanded eastward as white residents moved to outlying sections of the city, while discrimination and violence kept even middle-class Black families within the Central and Woodland area.
After World War II, as white suburbanization accelerated, the Black community expanded east and northeast into Hough and Glenville. Hough went from 5 percent nonwhite in 1950 to 74 percent nonwhite in 1960. In Glenville, which was largely Jewish in 1930 and about 8 percent African American, Jewish residents began relocating in the mid-1950s, and the neighborhood was mostly African American by the 1960s.
Expansion did not bring equal housing. Real estate agents used “blockbusting” tactics to set off panic selling by white owners in Hough in the 1950s, and landlords then subdivided houses into small apartments and raised rents. The consequences of those conditions are part of the story of the Hough uprising of 1966.
What work did migrants find?
Before World War I, Black Clevelanders were largely shut out of the steel mills and foundries that drove the city’s economy, and most trade unions excluded them. By 1910, only about 10 percent of Black men in the city worked in skilled trades.
The war years changed that. In the 1920s, migrants continued to pour into Cleveland for newly available industrial jobs, most of them unskilled factory labor, though some workers moved into semi-skilled and skilled positions. Discrimination persisted in clerical work and the unionized skilled trades. The Depression hit Black workers early and hard, and it was the industrial demand of World War II, along with the CIO’s union practices, that created new job opportunities.
Which churches and institutions served the newcomers?
Black Clevelanders built their own institutions as discrimination grew. A dozen new Black churches were founded between 1890 and 1915, and by 1915 Antioch Baptist Church was the largest Black church in the city. As the migration swelled after World War I, churches could meet only part of the newcomers’ needs.
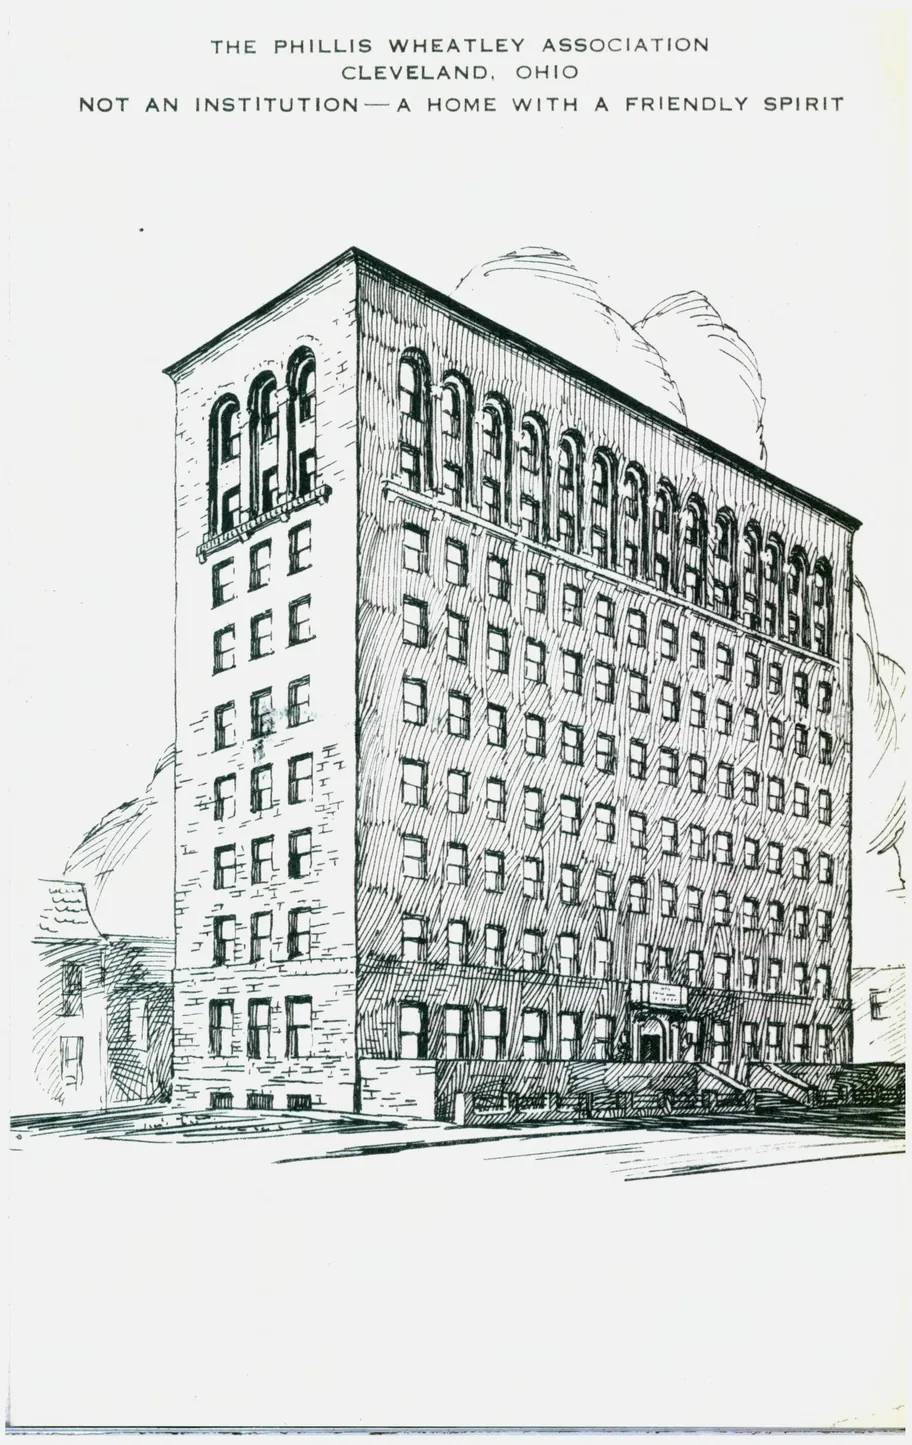
Other institutions filled the gap. Jane Edna Hunter founded the Phillis Wheatley Association in 1911 as a residential, job-training and recreation center for Black girls, and its nine-story building, shown above, was built in 1928. The Negro Welfare Association, founded in 1917 as an affiliate of the National Urban League, helped newcomers find jobs and housing. The Cleveland branch of the NAACP, established in 1912, had 1,600 members by 1922.
Political representation grew with the population. Thomas W. Fleming became the first African American elected to Cleveland City Council in 1915. A generation later, Carl and Louis Stokes, whose parents had come to Cleveland from Georgia during the Great Migration, grew up in the Outhwaite public housing project and went on to national careers. Cultural life grew too: Karamu House notes that many Black Southerners moved into its Central Avenue neighborhood in the early 1920s, a story told in our history of Karamu House.
How did redlining shape Black Cleveland?
Between 1935 and 1940, the federal Home Owners’ Loan Corporation (HOLC) graded neighborhoods across the country for mortgage risk, from A, colored green and deemed a minimal risk for lenders, to D, colored red and considered “hazardous.” The University of Richmond’s Mapping Inequality project, which has digitized these maps, includes Cleveland’s HOLC map, dated 1939.
Mapping Inequality’s introduction finds that African American neighborhoods “were all but universally categorized as ‘hazardous’ regardless of the income or class of residents,” and that the HOLC archive is full of language about the “infiltration” of populations described as “subversive,” “undesirable” or “inharmonious.” In the project’s words, the grades were “a tool for redlining: making it difficult or impossible for people in certain areas to access mortgage financing and thus become homeowners.”
Public policy compounded the damage in Cleveland. Kusmer notes that segregated public housing contributed to overcrowding in the 1930s, often demolishing more units than it built.
How did East Cleveland change?
East Cleveland, a suburban city in Cuyahoga County, became a later destination for Black families. According to the Encyclopedia of Cleveland History, the rapid growth of Glenville’s Black population in the 1950s spilled over into East Cleveland’s westernmost neighborhoods. In the 1960s, blockbusting real estate tactics again stoked panic selling, and East Cleveland went from 2 percent Black in 1960 to 67 percent in 1970. By 1980, 86 percent of its 36,957 residents were African American, second only to East St. Louis, Illinois, among major suburbs nationally. Our history of East Cleveland follows the city’s full arc.
The East Cleveland Oral History Project, directed by Nick Mays, Ph.D., records this history in residents’ own words. Its 25 transcribed interviews, conducted in 2025 in partnership with the Cuyahoga Land Bank, are archived in the Cleveland Voices collection of Cleveland State University’s Center for Public History + Digital Humanities. Some of the narrators describe their own families’ journeys from the South.
MaryAnn Harris recalled the South she left as a child: “I left Georgia, Moultrie, Georgia, at age 8. But during the time I was living in Georgia, my mother worked in the cotton fields” (MaryAnn Harris, Cleveland Voices). She went on to a long career in education and librarianship in Cleveland and East Cleveland schools.
Stacy Clark-Warren described her family’s migration from Alabama and Georgia, and how her parents’ East Cleveland home became a support center for relatives and friends moving north in search of opportunity. Of her father, she said: “So he left the south because he was not happy with what was going on in the South” (Stacy Clark-Warren, Cleveland Voices). The project is described in full in our overview of the East Cleveland Oral History Project.
Why does the Great Migration matter now?
Many Cleveland families can trace their roots to a town in Georgia, Alabama or another Southern state, and the institutions their grandparents built still shape the East Side. The migration also explains patterns that remain visible today, from housing to political power, because the choices families made were constrained by lending maps, real estate practices and job discrimination.
Census tables give the scale, but the reasons people left and what they found are often held only in family memory. Mays HisToracle Consulting helps families, congregations and community organizations capture those stories through historical research and oral history project design.
Questions people ask
When did the Great Migration happen?
The National Archives describes the Great Migration as the movement of approximately six million Black people from the American South to Northern, Midwestern and Western states, roughly from the 1910s until the 1970s. In Cleveland, growth came in two large waves: during and after World War I, and again during and after World War II, when war industry and new union practices opened jobs.
How many Black residents lived in Cleveland during the Great Migration?
U.S. Census figures compiled by the Census Bureau show 8,448 Black residents in Cleveland in 1910, or 1.5 percent of the city. The count reached 71,899 in 1930, 250,818 in 1960 and a peak of 287,841 in 1970, when Black Clevelanders made up 38.3 percent of the population. The share kept rising after 1970 as the city’s total population fell.
Where did Black migrants settle in Cleveland?
Most early newcomers settled in the Central Avenue district, between the Cuyahoga River and East 40th Street, according to the Encyclopedia of Cleveland History. After World War II the community expanded east and northeast into Hough and Glenville. In the 1960s, East Cleveland, a suburb in Cuyahoga County, went from 2 percent Black in 1960 to 67 percent in 1970.
What was redlining in Cleveland?
Redlining refers to maps and appraisals that marked neighborhoods as risky for mortgage lending. The federal Home Owners’ Loan Corporation graded neighborhoods from A, colored green, to D, colored red and labeled hazardous. Its Cleveland map, dated 1939, can be viewed through the Mapping Inequality project. Nationally, the project finds that Black neighborhoods were almost always graded hazardous regardless of residents’ income.
Sources
- The Great Migration (1910-1970), National Archives and Records Administration.
- Historical Census Statistics on Population Totals by Race, 1790 to 1990 (Working Paper No. 76, Table 36: Ohio), U.S. Census Bureau.
- African Americans, Encyclopedia of Cleveland History, Case Western Reserve University.
- Glenville, Encyclopedia of Cleveland History, Case Western Reserve University.
- Hough, Encyclopedia of Cleveland History, Case Western Reserve University.
- East Cleveland, Encyclopedia of Cleveland History, Case Western Reserve University.
- Mapping Inequality: Redlining in New Deal America, Introduction (Robert K. Nelson), Digital Scholarship Lab, University of Richmond.
- Mapping Inequality: Cleveland, Ohio (1939), Digital Scholarship Lab, University of Richmond.
- East Cleveland (collection of 25 transcribed interviews), Cleveland Voices, Center for Public History + Digital Humanities, Cleveland State University.
- MaryAnn Harris Interview, 04 November 2025, Cleveland Voices, Cleveland State University.
- Stacy Clark-Warren Interview, 11 November 2025, Cleveland Voices, Cleveland State University.
- History, Karamu House.
- Stokes, Louis, Encyclopedia of Cleveland History, Case Western Reserve University.